| Indicator | Description |
|---|---|
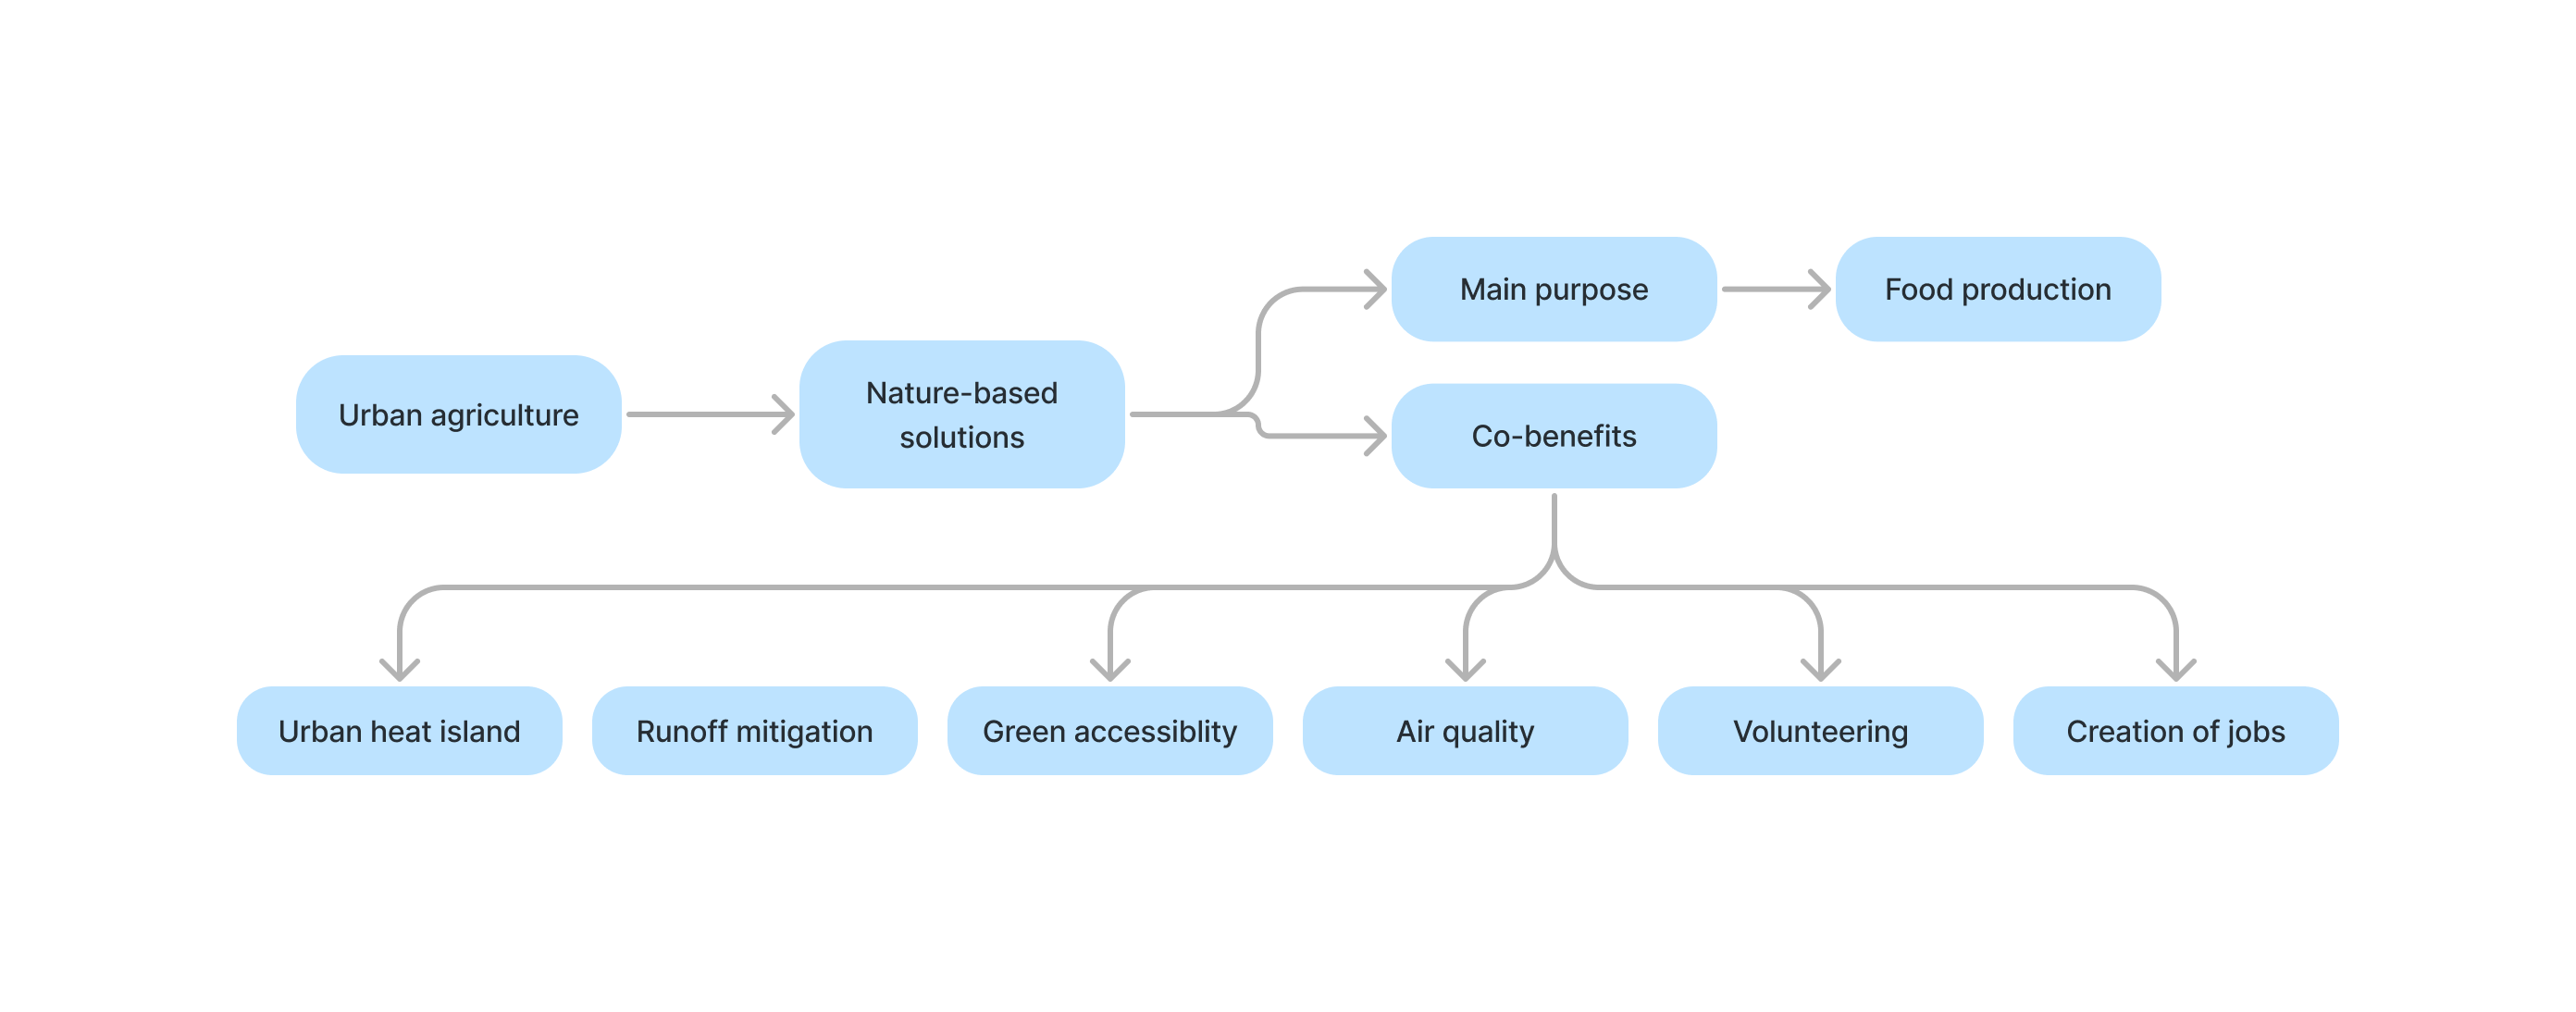
| food_production | Amount of food produced in the city. |
| green_capita | Green per capita can be computed as raw or as the difference among neighbourhoods. |
| green_distance | Distance to closest public green area larger than certain surface. It computes also the proportion of homes that are further than a specific threshold. |
| UHI | Urban heat island as a raster (stars object) or as numeric values. |
| edible_jobs | Number of jobs created by commercial urban agriculture. |
| edible_volunteers | Number of volunteers involved in community urban agriculture. |
| no2_seq | Amount of NO2 sequestered by urban green (in gr/s). |
| runoff_prev | Runoff in the city after a specific rain event. It also computes the amount of rainwater harvested by urban agriculture initiatives. |
Beyond food
A stochastic model to estimate the contributions of urban agriculture to sustainability
4/21/23
A bit of context
- There is a lot of research to model the food production.
- However, there is no clear evidence about the extent that urban agriculture contributes to sustainability in cities.
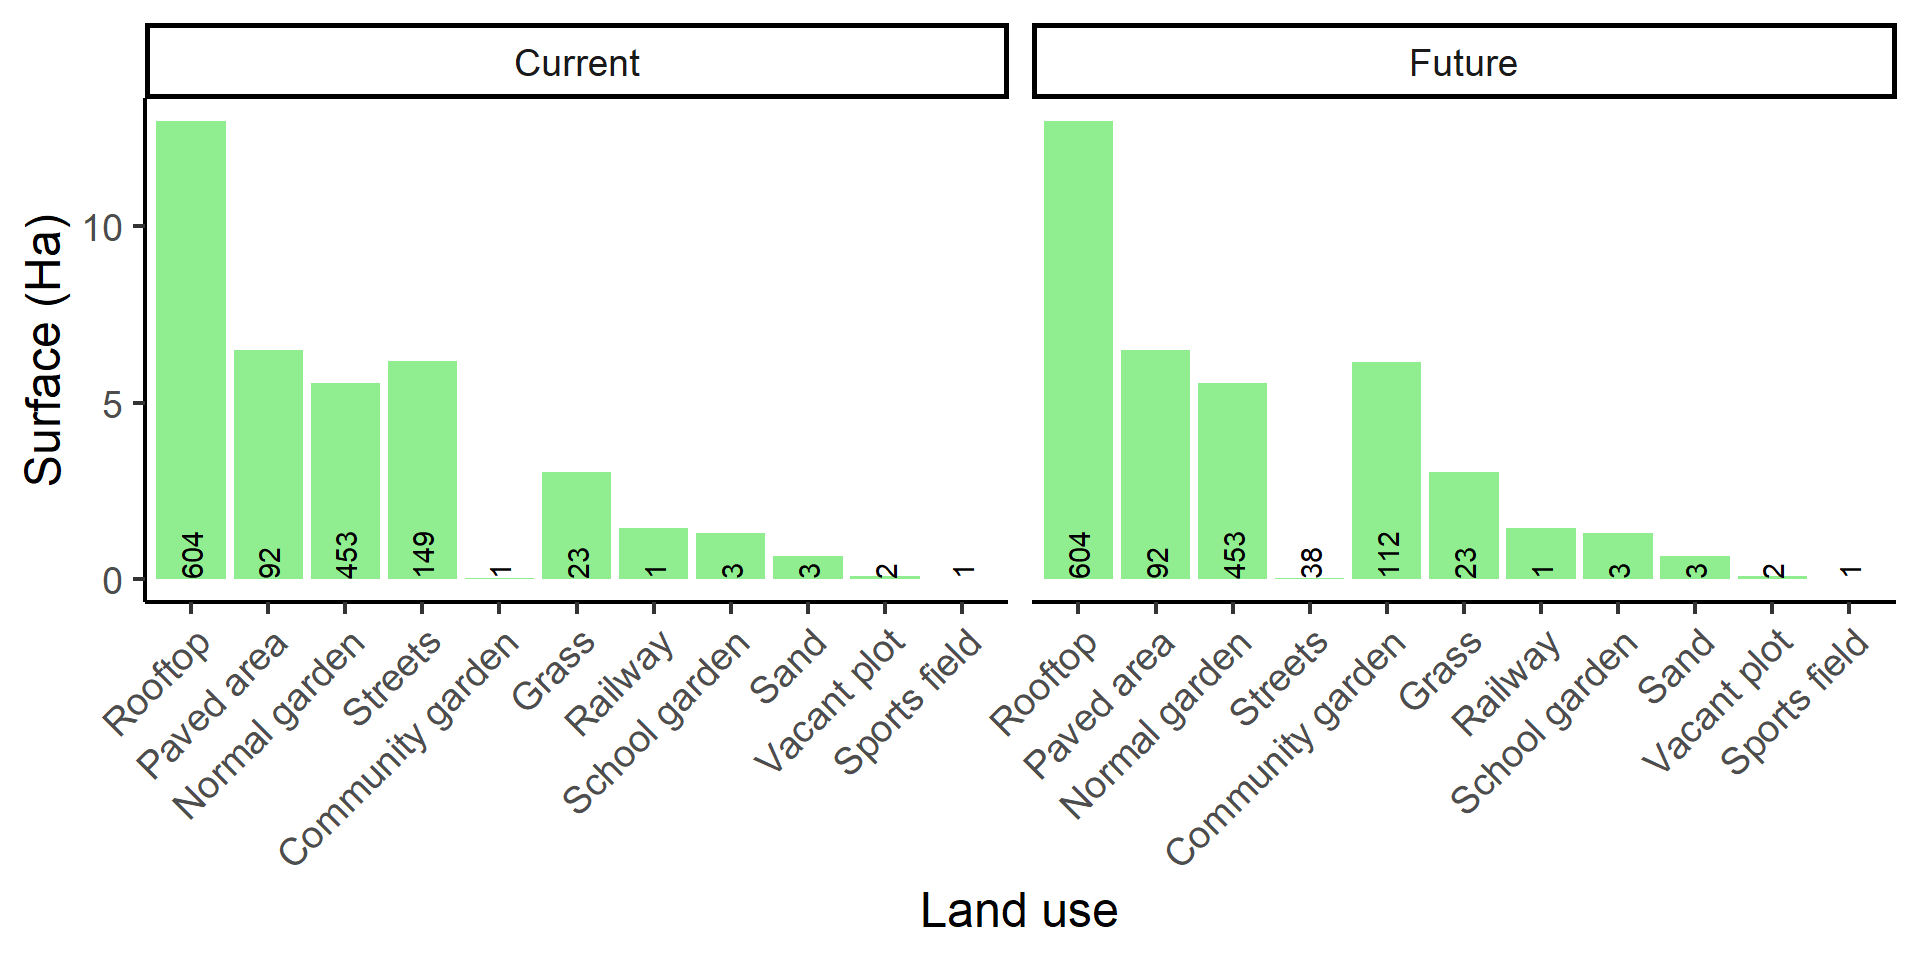
Land uses
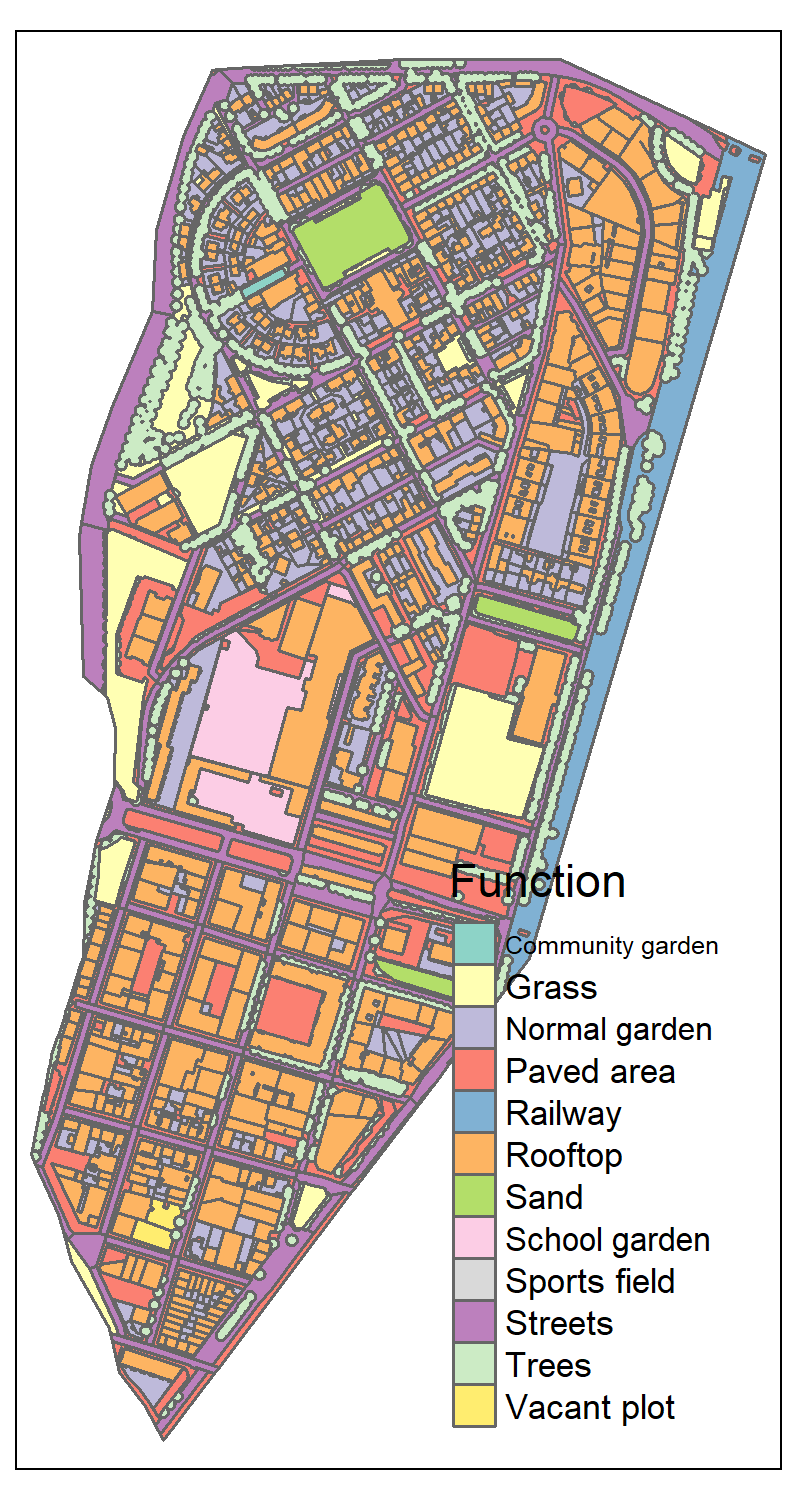
- Rooftops (i.e. building footprints) are the most frequent land use and the one with the greatest extension.
- However, only 39 rooftops are flat, and thus potential urban gardens. And from those, only 6 have more than 50 m2 of flat surface.
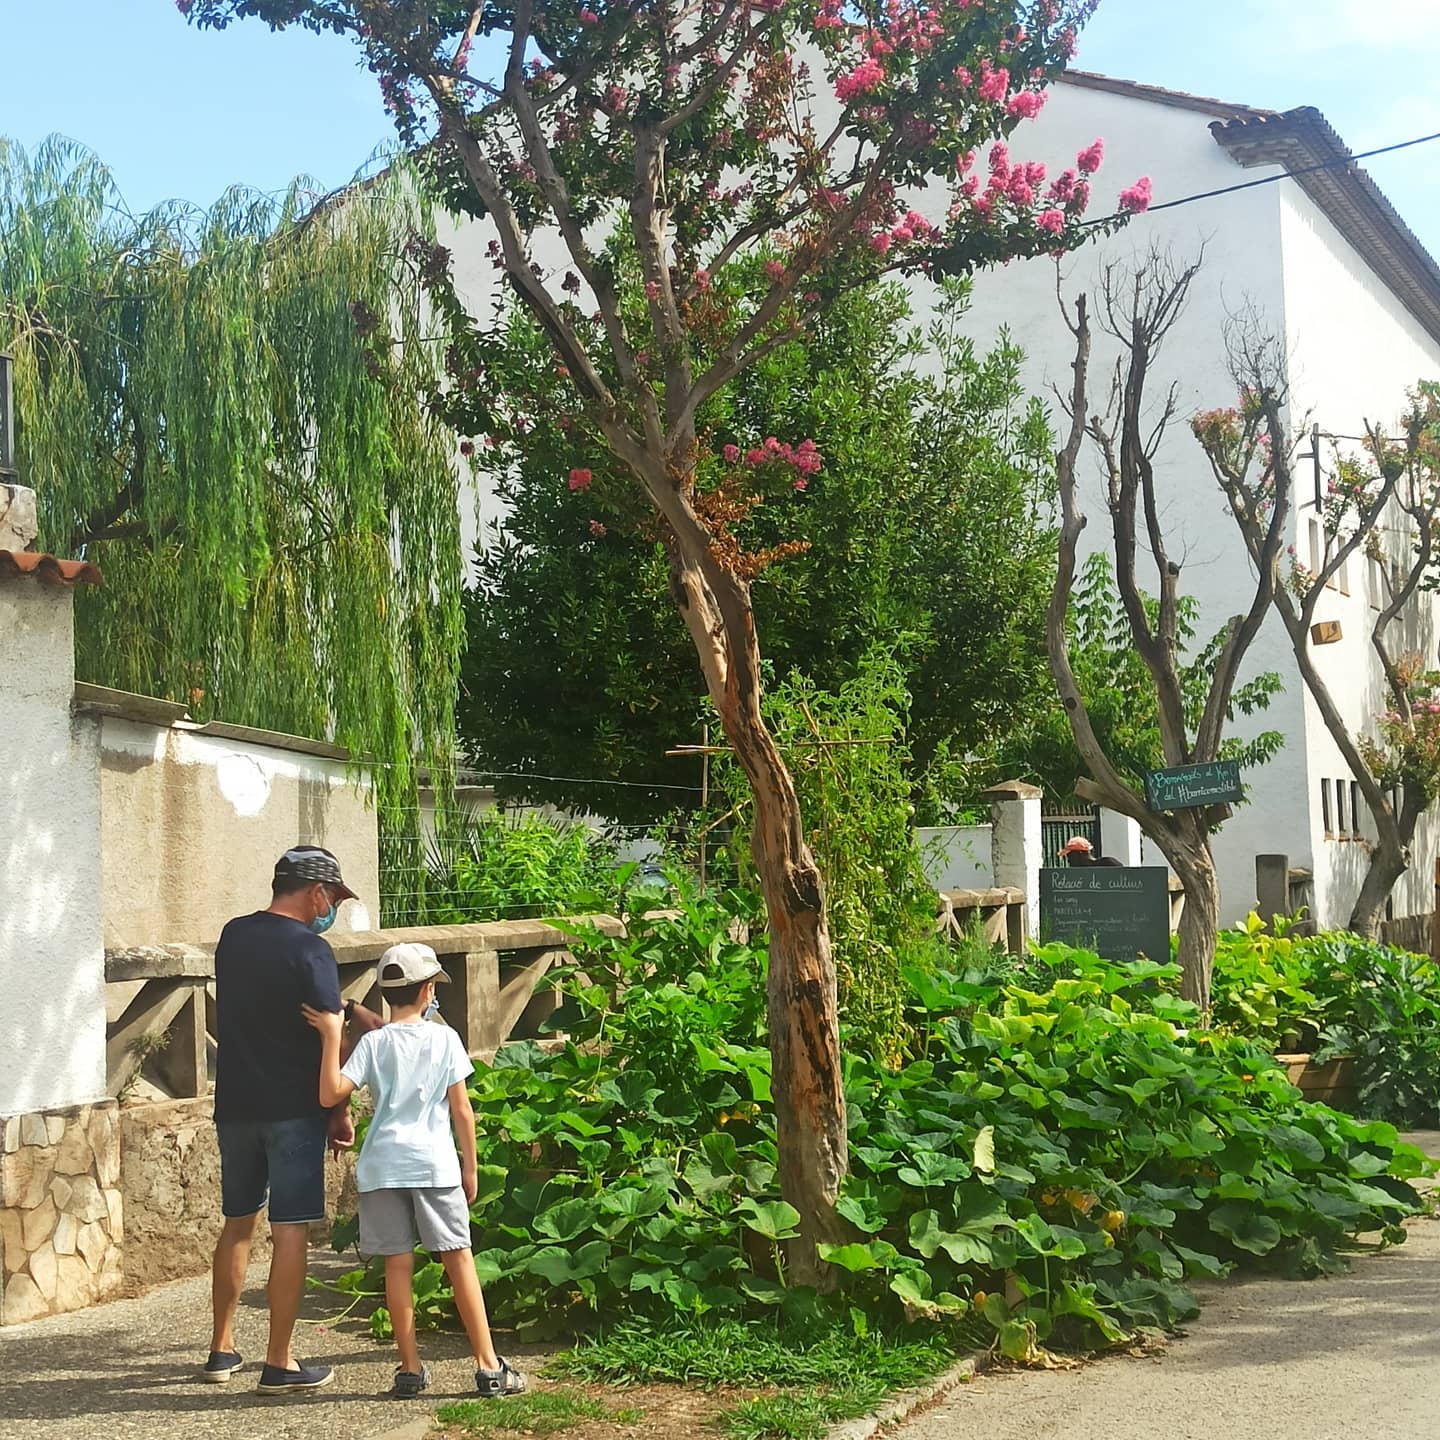
- So, we will focus on gardens on the ground.
Urban garden scenarios
- We compare the current and a future scenario where all streets larger than 100 m2 were converted to community urban gardens (111 streets).
- Each community garden occupied between 52% and 75% of the street’s surface.
- The scenario simulation was randomized using a Monte carlo iteration of 1,000 times.
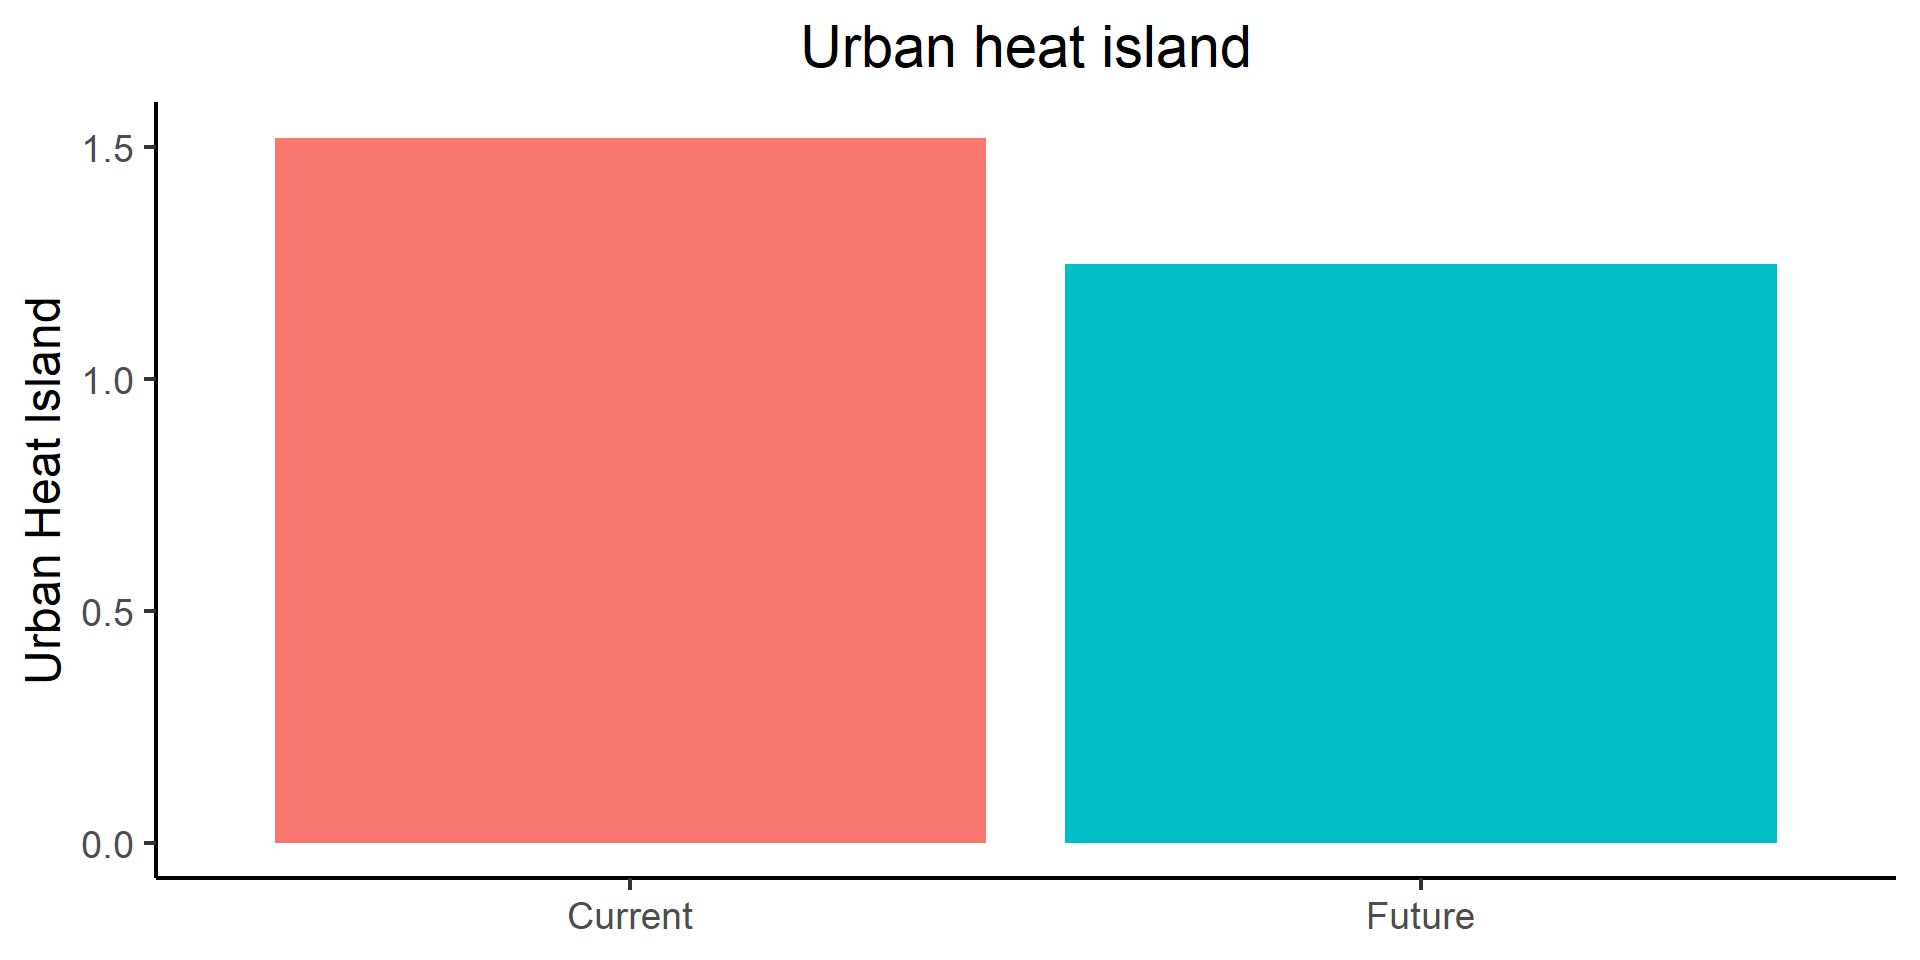
Urban heat island
The UHI indicator measures the overall urban heat island using the sky view factor and the land covers.
\[ UHI = \frac{1}{N}\sum_{i=1}^{N}{(2 - SVF_i - Fveg_i) \times \sqrt[4]{\frac{\frac{Q_ql}{C_air \times P_air} \times \Delta{T^3}}{U}}} \]
The future scenario will suppose a reduction of 0.27 degrees of average temperature in the neighbourhood.
Runoff mitigation
This indicator calculates the average height of runoff in the scenario using the SCS runoff curve number method.
\[ Q = \frac{(P - I_a)^2}{(P - I_a) + S} \] where \(P\) is the rainfall volume in mm; \(I_a\) is the initial abstraction (all losses before runoff begins); and \(S\) is the potential soil moisture retention. The SCS generalizes \(I_a\) as \(0.2S\), we modified this generalization to include the rainwater harvested:
\[ I_a = 0.2S + \sum_{i=1}^{N}{min\{Rh, Ws\}_i} \] where \(Rh\) is the potential water harvested, calculated as the amount of water fallen on the surface of adjacent higher buildings; and \(Ws\) is the water storage capacity. From both, the minimum is used to calculate \(I_a\).
Given a rain event of 85 l/day, the difference in runoff prevention between current and future scenario is 1.36 mm.
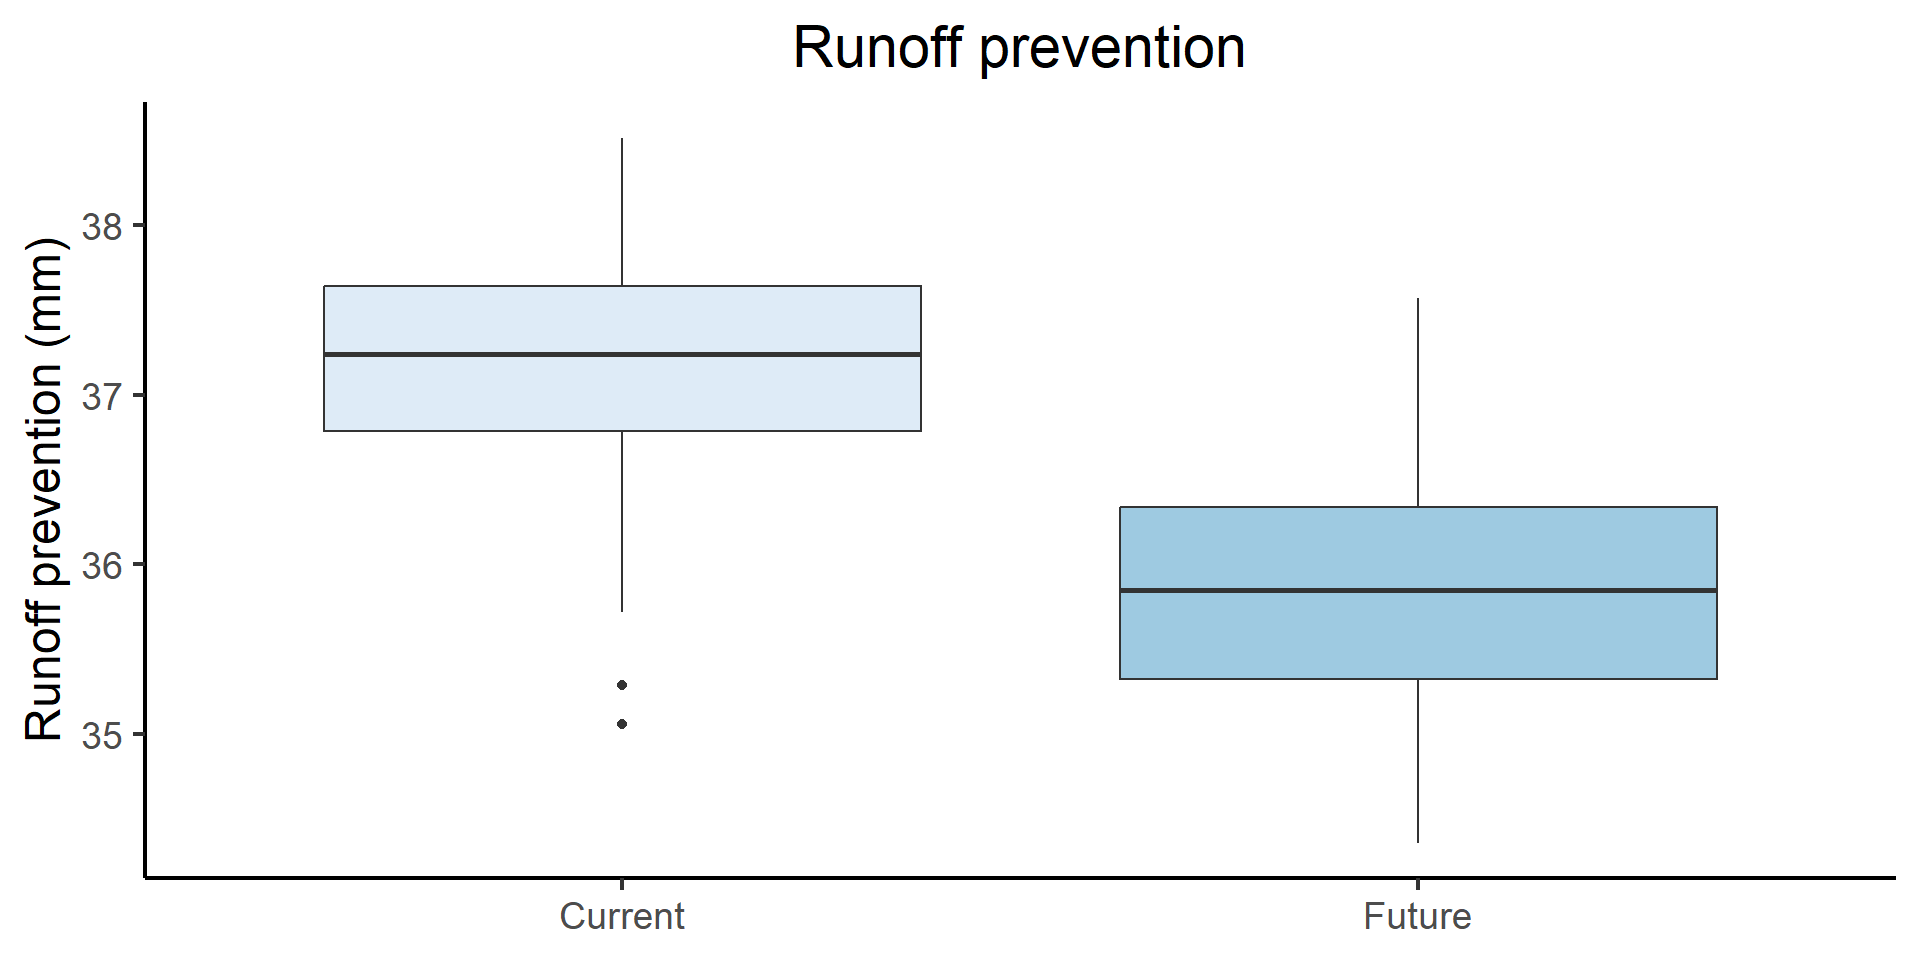
The volumes of tanks were randomly distributed between 0 and 45 l/m2 of garden i.
Green per capita
This indicator not only considers public green areas, but also private green areas (gardens) to compensate those areas with more dense urban fabric.

Sant Narcís nord is less dense than the southern part and this is reflected in the indicator. However, green per capita increases in both districts. Percentually, it increases more in Sant Narcís sud (123.78%) than in the northern part (53.02%).
NO2 sequestered by urban green
Nitrogen dioxide is a good proxy of overall air quality and one of the most concerning issues in cities, with important consequences on respiratory diseases and lung cancer. This indicator calculates the amount of NO2 sequestered by urban green and urban agriculture solutions (in g/s).
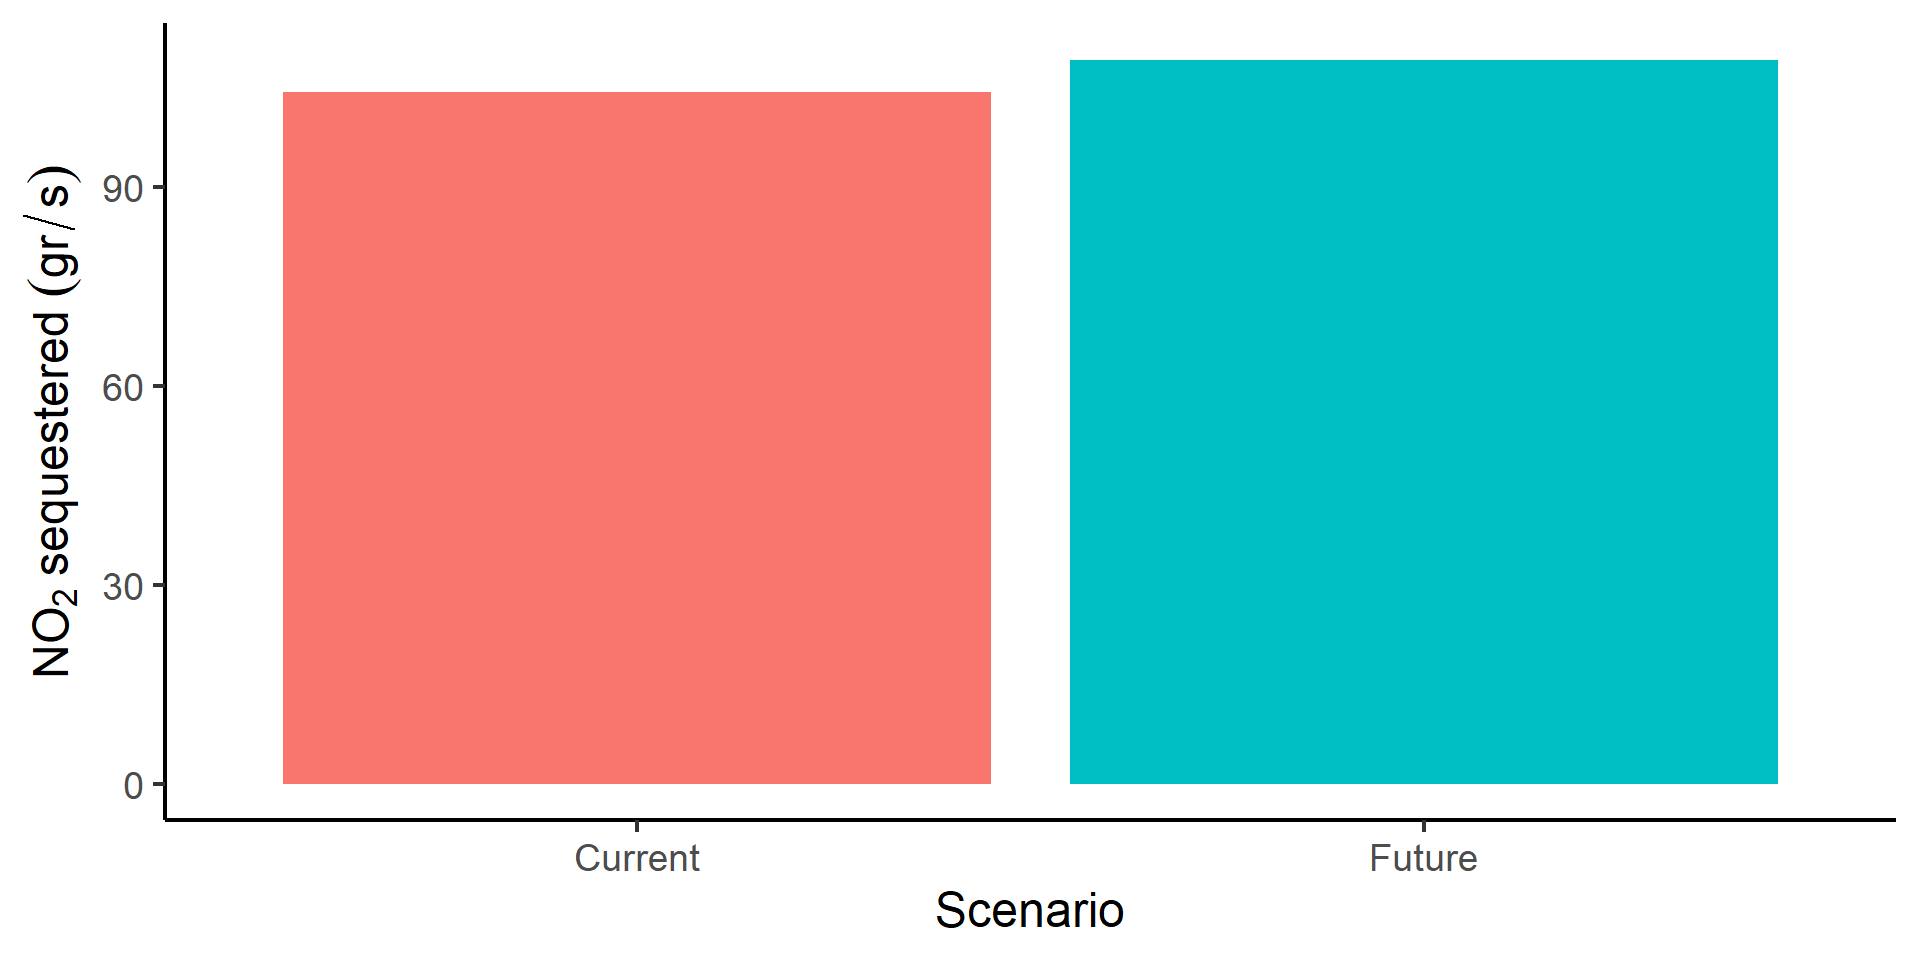
The future scenario would have the potential to sequester 4.9 gr/s of NO2 more than the current scenario. For reference, a car at 50 km/h emits around 0.84 gr/s.
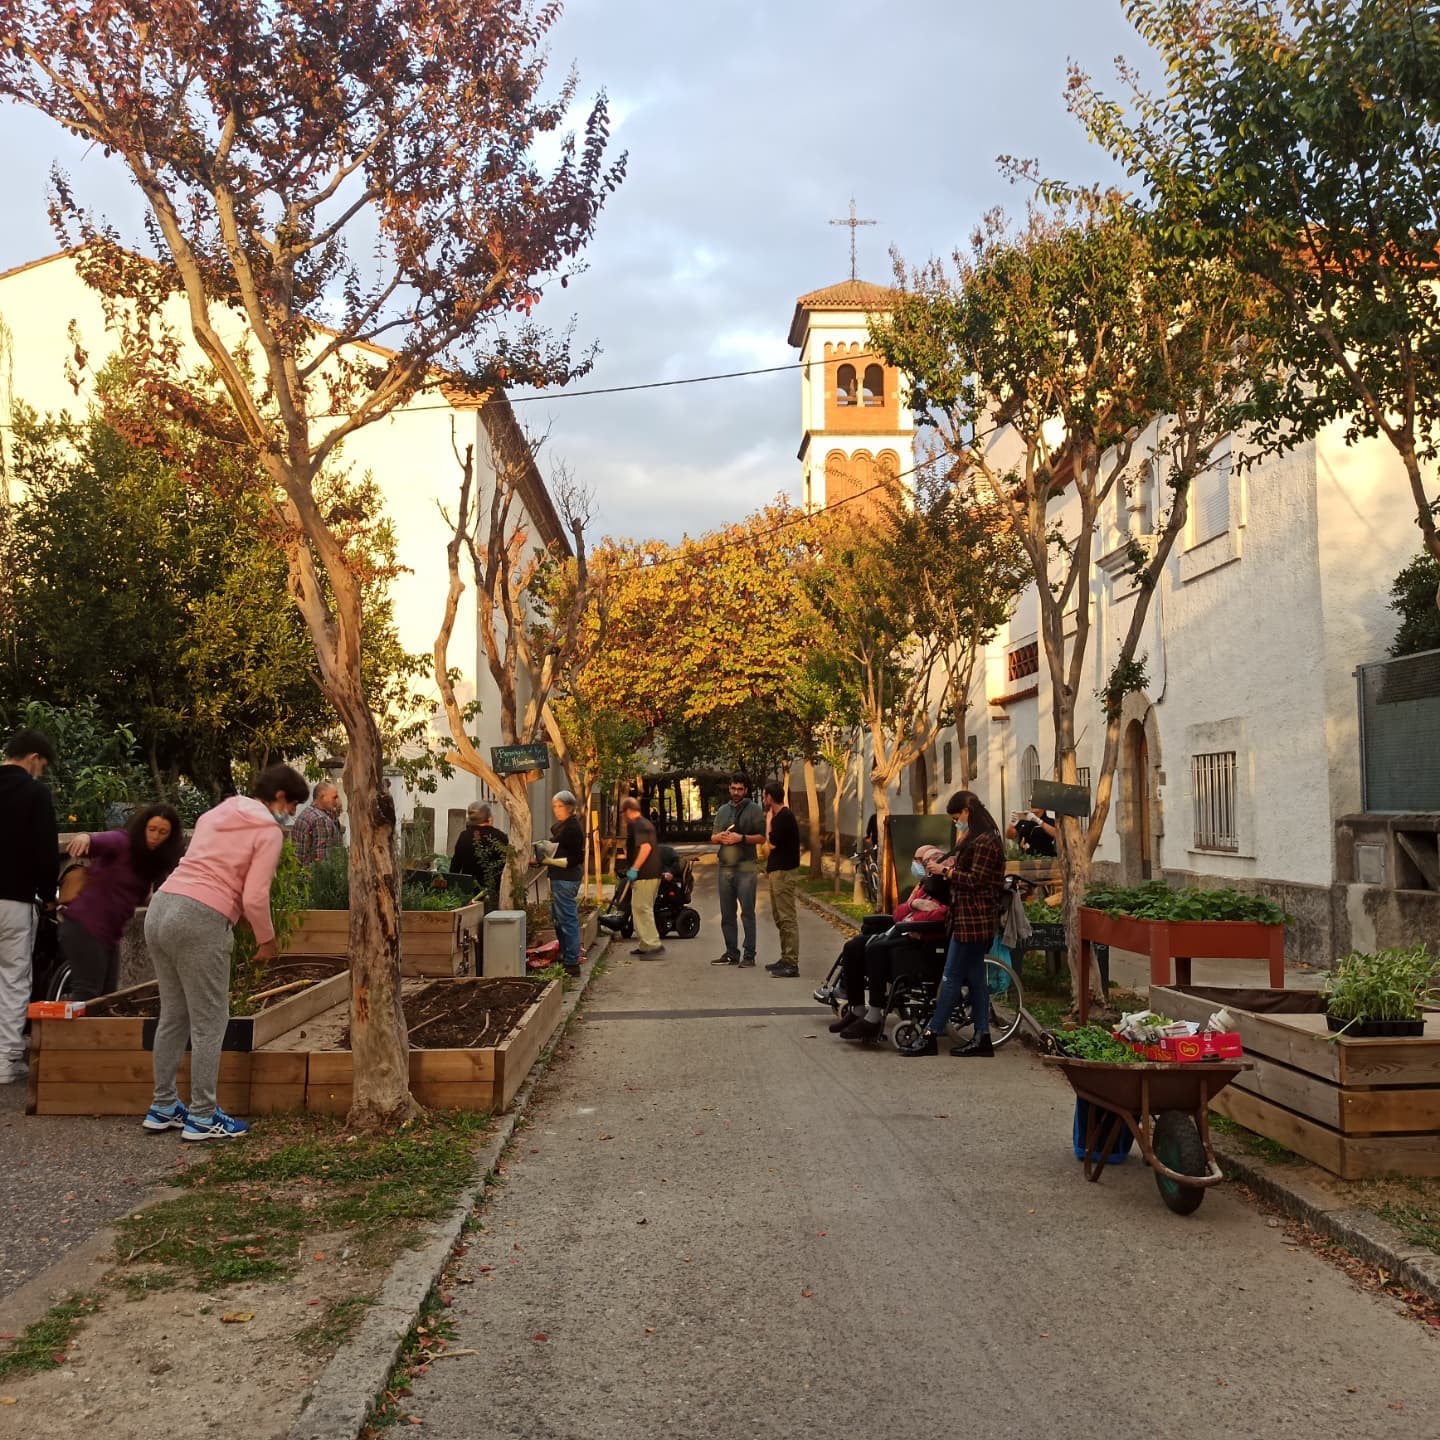
Volunteers involved in urban agriculture
We used the same equation to calculate jobs and volunteers with different values of k, in this case:
\[ volunteers = \sum_{i=1}^{N}a_i \times k \]
where \(a_i\) is the area in m2 used to grow plants in the element \(i\); and \(k\) is the number of jobs or volunteers by m2. \(k\) is sampled from a random uniform distribution between 1.63e-03 and 2.2e-01. Then, a Monte Carlo simulation of 1,000 iterations is executed to estimate a distribution.

Despite the uncertainty, the indicator clearly shows how the number of volunteers involved in community gardens in the future scenario is relevant.
While in the current scenario the number of estimated volunteers is between 2 and 33, the number of volunteers estimated in the future scenario is between 475 and 8,191.
The number of inhabitants in Sant Narcis 6,318.
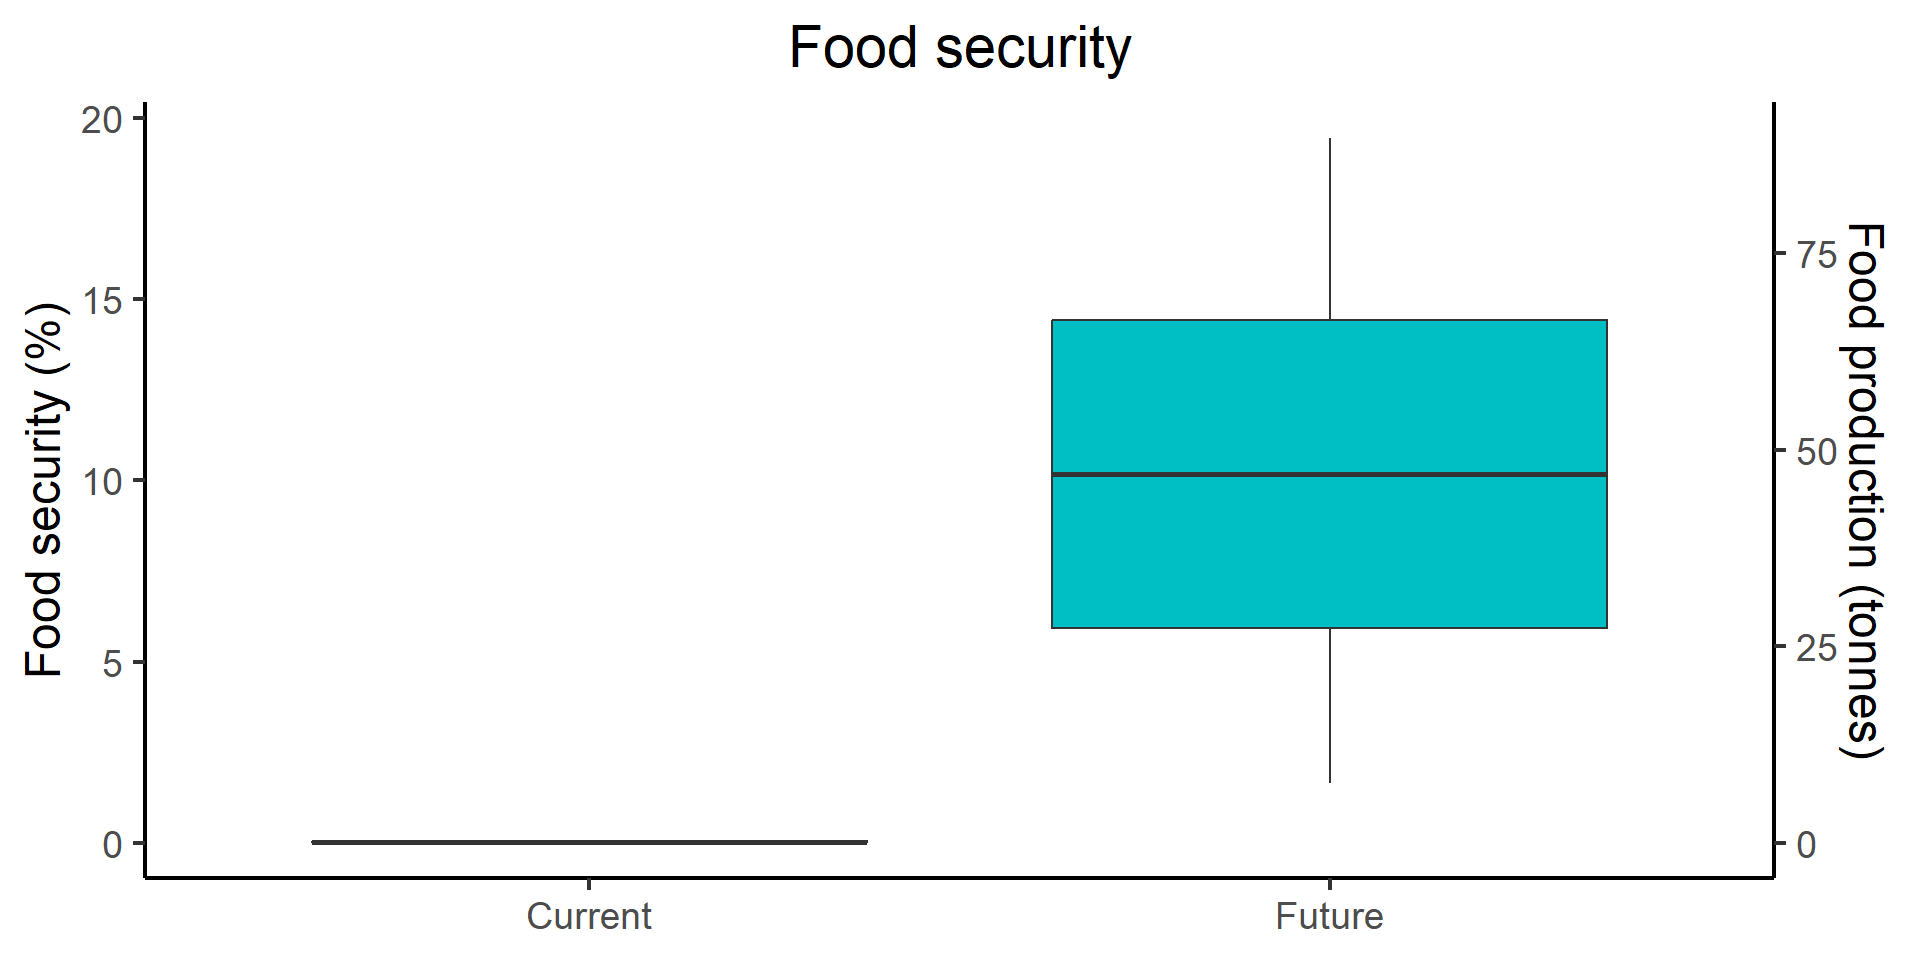
Food security
The food security is considered the ratio between the food produced and consumed in the neighbourhood.
- The current scenario, in average, might produce the 0.04% of the food consumed (192 kg/year in average).
- This value increases to 10.19% in the future scenario (47 tonnes/year in average).
Conclusions
- Urban agriculture is cool!
- Other conclusions are up to you. 😉